

I’ve been travelling a bunch for work over the past few weeks so I am a little delayed in getting my March analysis out. With that said, better late than never!
Below you’ll see my overall generation and consumption for March 2019.
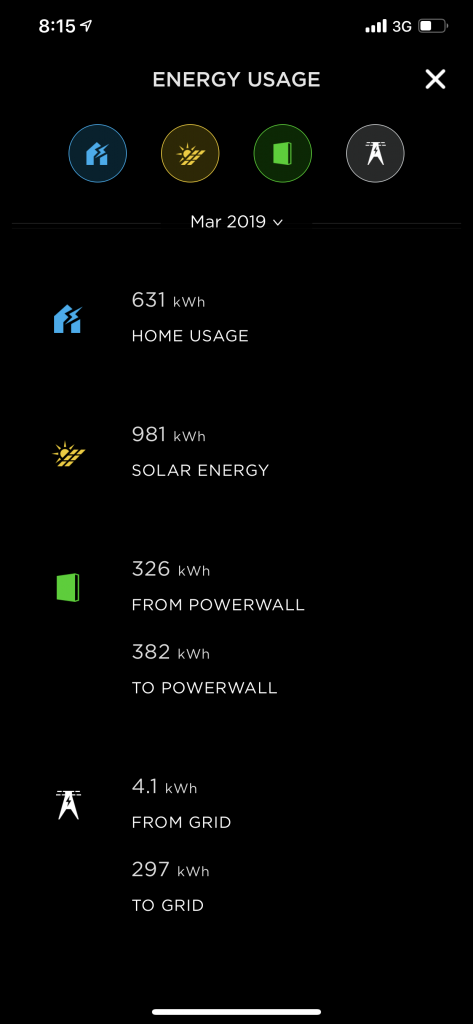
March 2019 detailed statistics 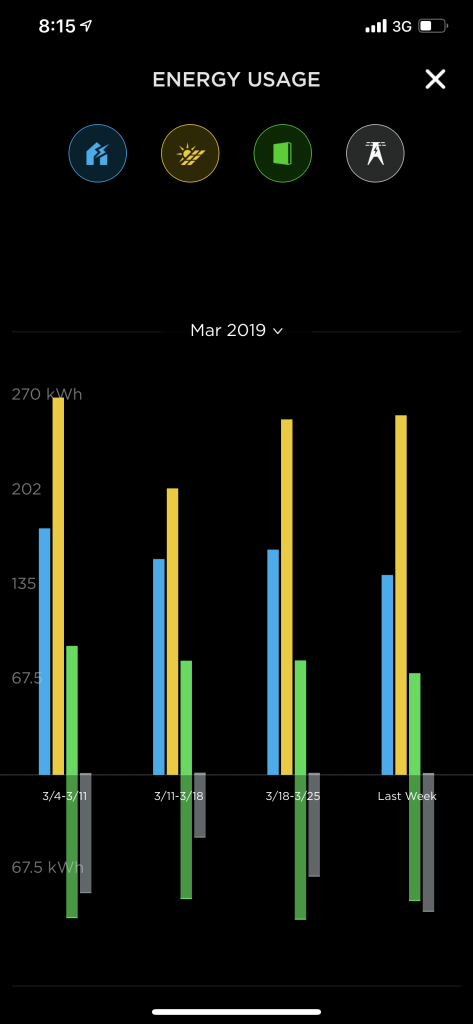
March week to week stats
March Energy figures without Solar and Powerwall 2
Daily Supply Charge – $0.924 per day * 31 = $28.64
Power Usage (from grid) – $0.3179 per kWh * 635.1 = $201.90
Total bill = $230.54
March Energy figures with Solar and Powerwall’s!
Daily Supply Charge – $0.924 per day * 31 = $28.64
Power Usage (from grid) – $0.3179 per kWh * 4.1 = $1.30
Solar Credits (to grid) – $0.20 per kWh * 297 – ($59.40)
Total bill = ($29.46) – that’s a little better!
That’s a total turnaround of $260 for the month of March alone. If I now look at total savings since I have started blogging month to month we now sit at $1377.45 – in 4 months!

Powerwall 2 Efficiency and Utilisation
Another item I wanted to start reporting on is how does the efficiency and utilisation of Powerwall change during the months of the year. For March 2019 we see the below:
- Efficiency: 85.3%
- Utilization: 38.9%
Thanks as always for reading, if you have any questions or feedback on this post please feel free to add them in the comments below.