If you are a frequent reader of my blog, you’ll remember last month I actually had a power bill to pay last month! That post was located here
Well, fast forward a month and I’ve received my July bill and thankfully I am back in credit, just! Take a look below for the analysis.
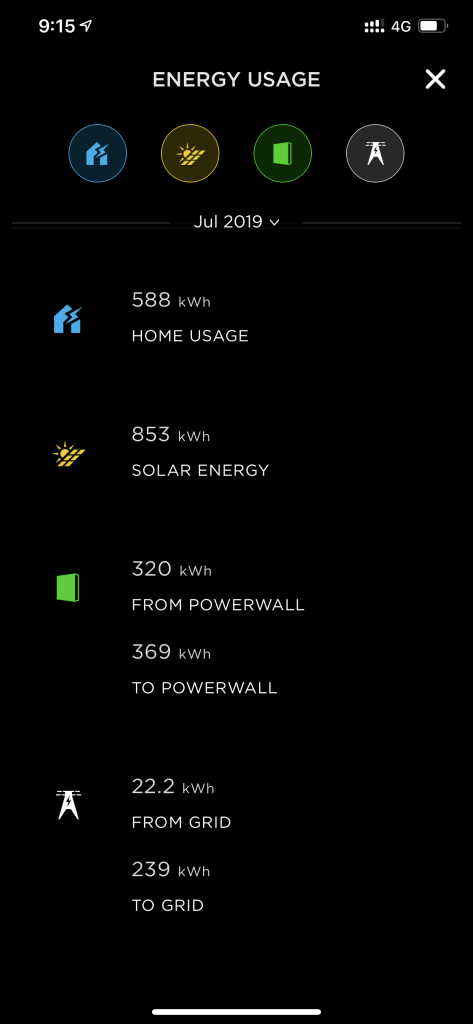

July figures without Solar and Powerwall 2
- Daily Supply Charge – $0.924 per day * 31 = $28.64
- Power Usage (from grid) – $0.23 per kWh * 588 = $135.24
- Total bill = $163.88
July figures with Solar and Powerwall 2
- Daily Supply Charge – $0.924 per day * 31 = $28.64
- Power Usage (from grid) – $0.23 per kWh * 22.2 = $5.11
- Solar Credits (to grid) – $0.20 per kWh * 239 – ($47.80)
- Total bill = ($14.05)
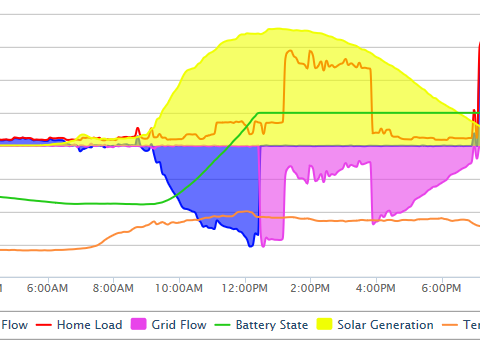
Powerwall 2 Efficiency and Utilisation
- Efficiency: 86.7% – up by 3.3% since the last report.
- Utilization: 38.2% – down by 0.9% since the last report.
Powerwall specific costs
So there has been a lot of commentary on Whirlpool as to whether Powerwall is cost beneficial or not. A calculation by Whirlpool user swainstm has been provided to work through these costs. So lets use the following – From PW kWh * your usage tariff – To PW kWh * your FiT
Using the above calculation shows that for the month of July my Powerwalls actually cost me $0.20 to operate them.
Again, I am being transparent with this data. This data is calculated on a single rate AGL plan, which I am not actually on. It’s just easier to match data from Powerwall stats using a single rate as Tesla doesn’t break down the TOU rates which is what I am actually on.